 Scanners Tally
What we do
Scanners Tally is a purpose-built companion app for professional livestock scanners.
Instead of wrangling notebooks or spreadsheets after a job, Scanners Tally lets you capture results as you go. At the end of the job you have clean tallies, expected lambing and calving numbers, and an instantly shareable summary for the farmer.
Built by scanners, for scanners.
A dependable suite of tools to help you manage your scanning data.
Easy to setup, and even easier to use.
Setup your account
Add your clients and their details. Some key details like where their farm is, and contact information help you deliver a high quality service.
Add columns to the table, add your tallies.
Add each mob as a column, detailing the name and type. Add your tallies after each mob is scanned.
Share
Send them an e-mail with the PDF attached. Farmers can choose to see their results in their own portal with additional benchmarking and information if they wish.
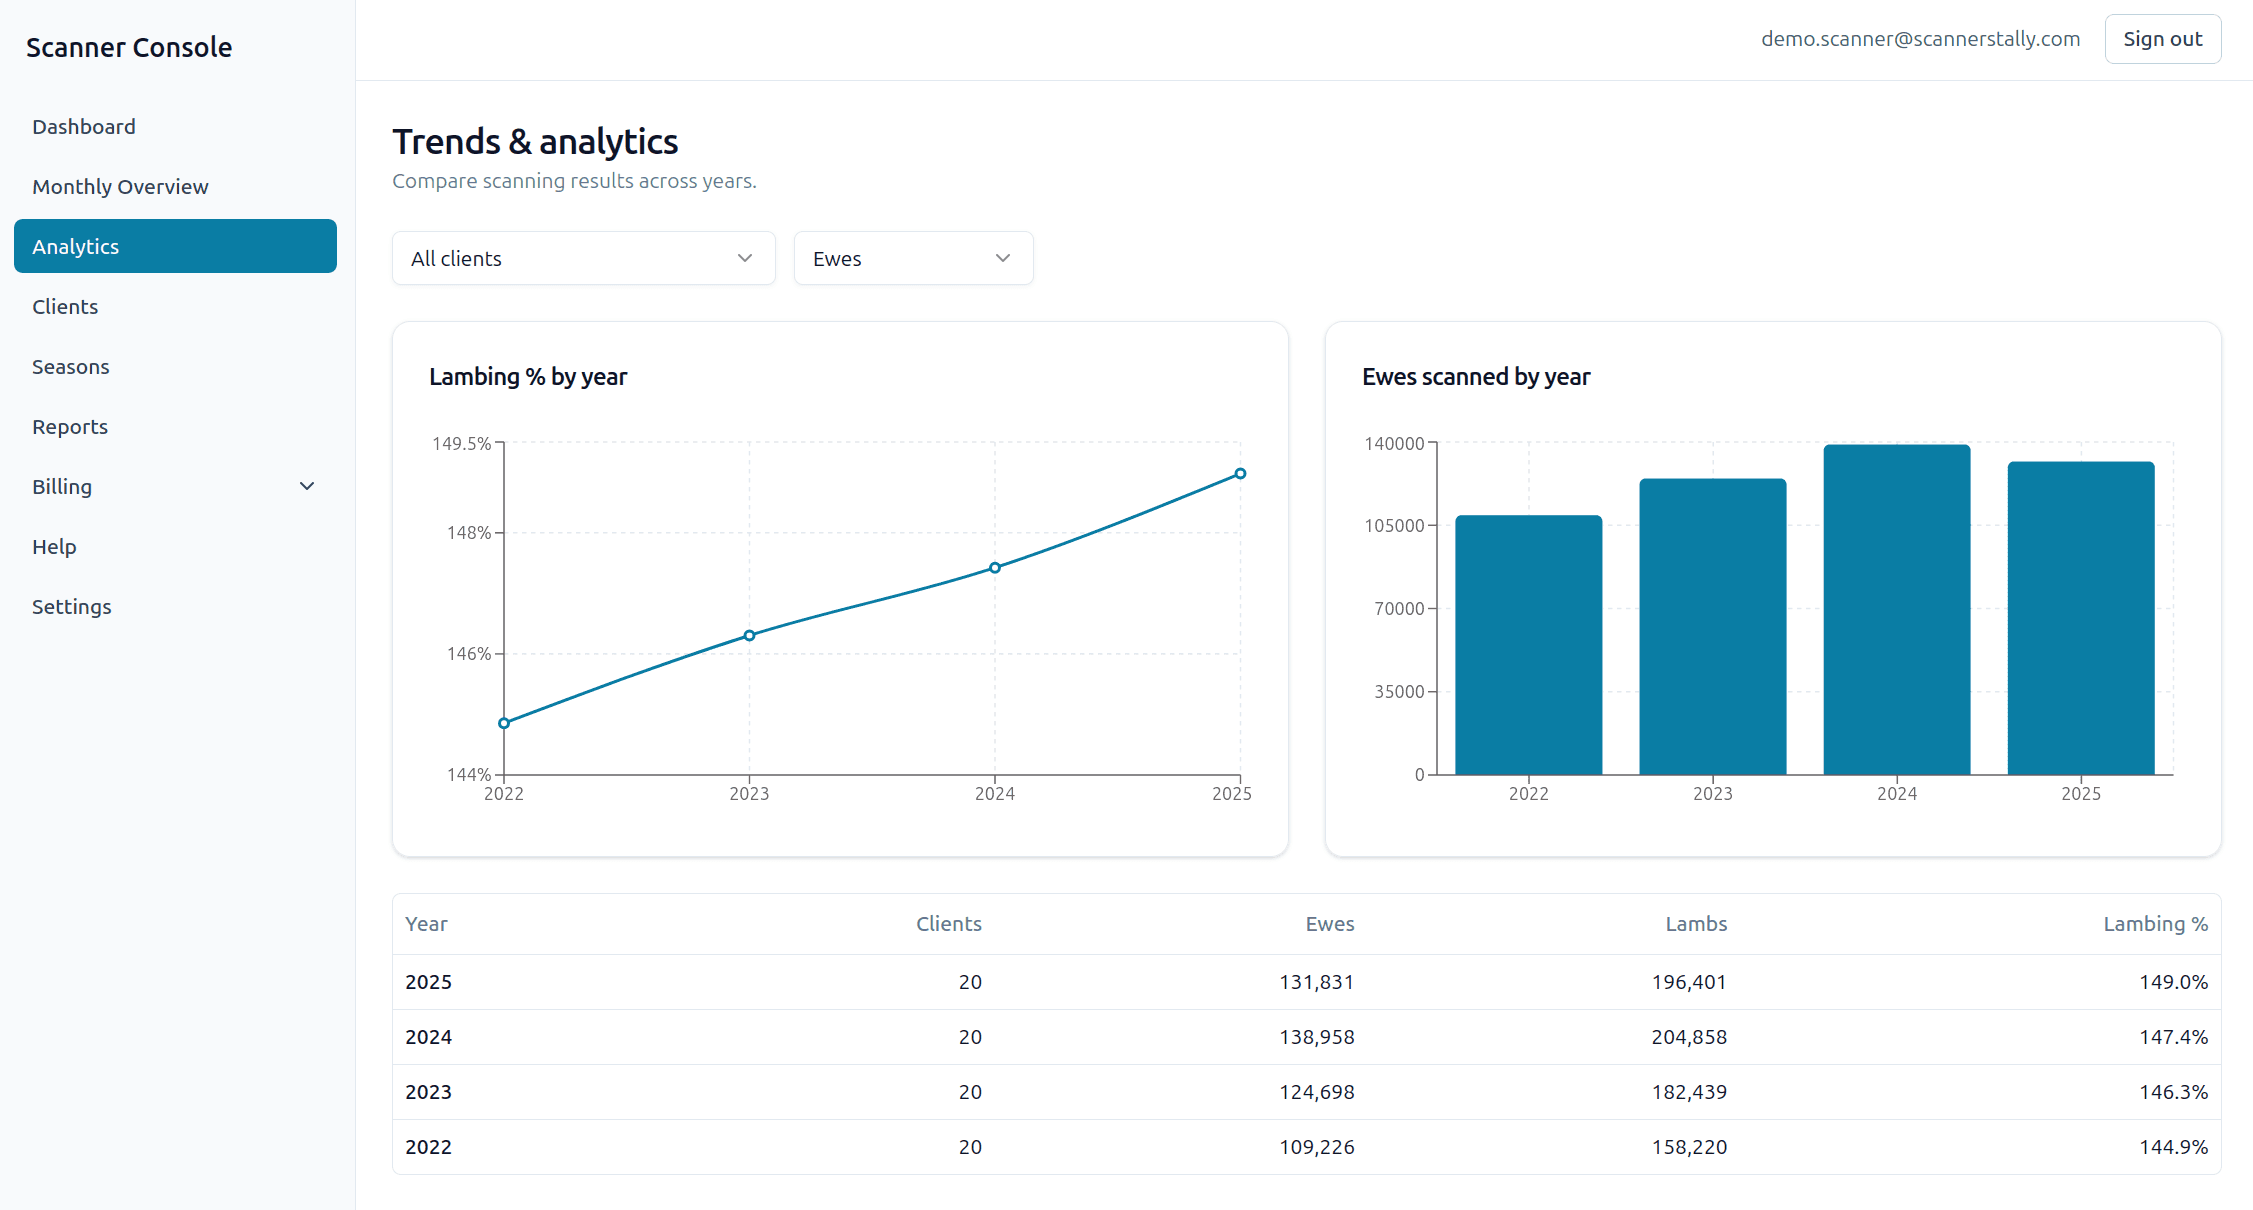
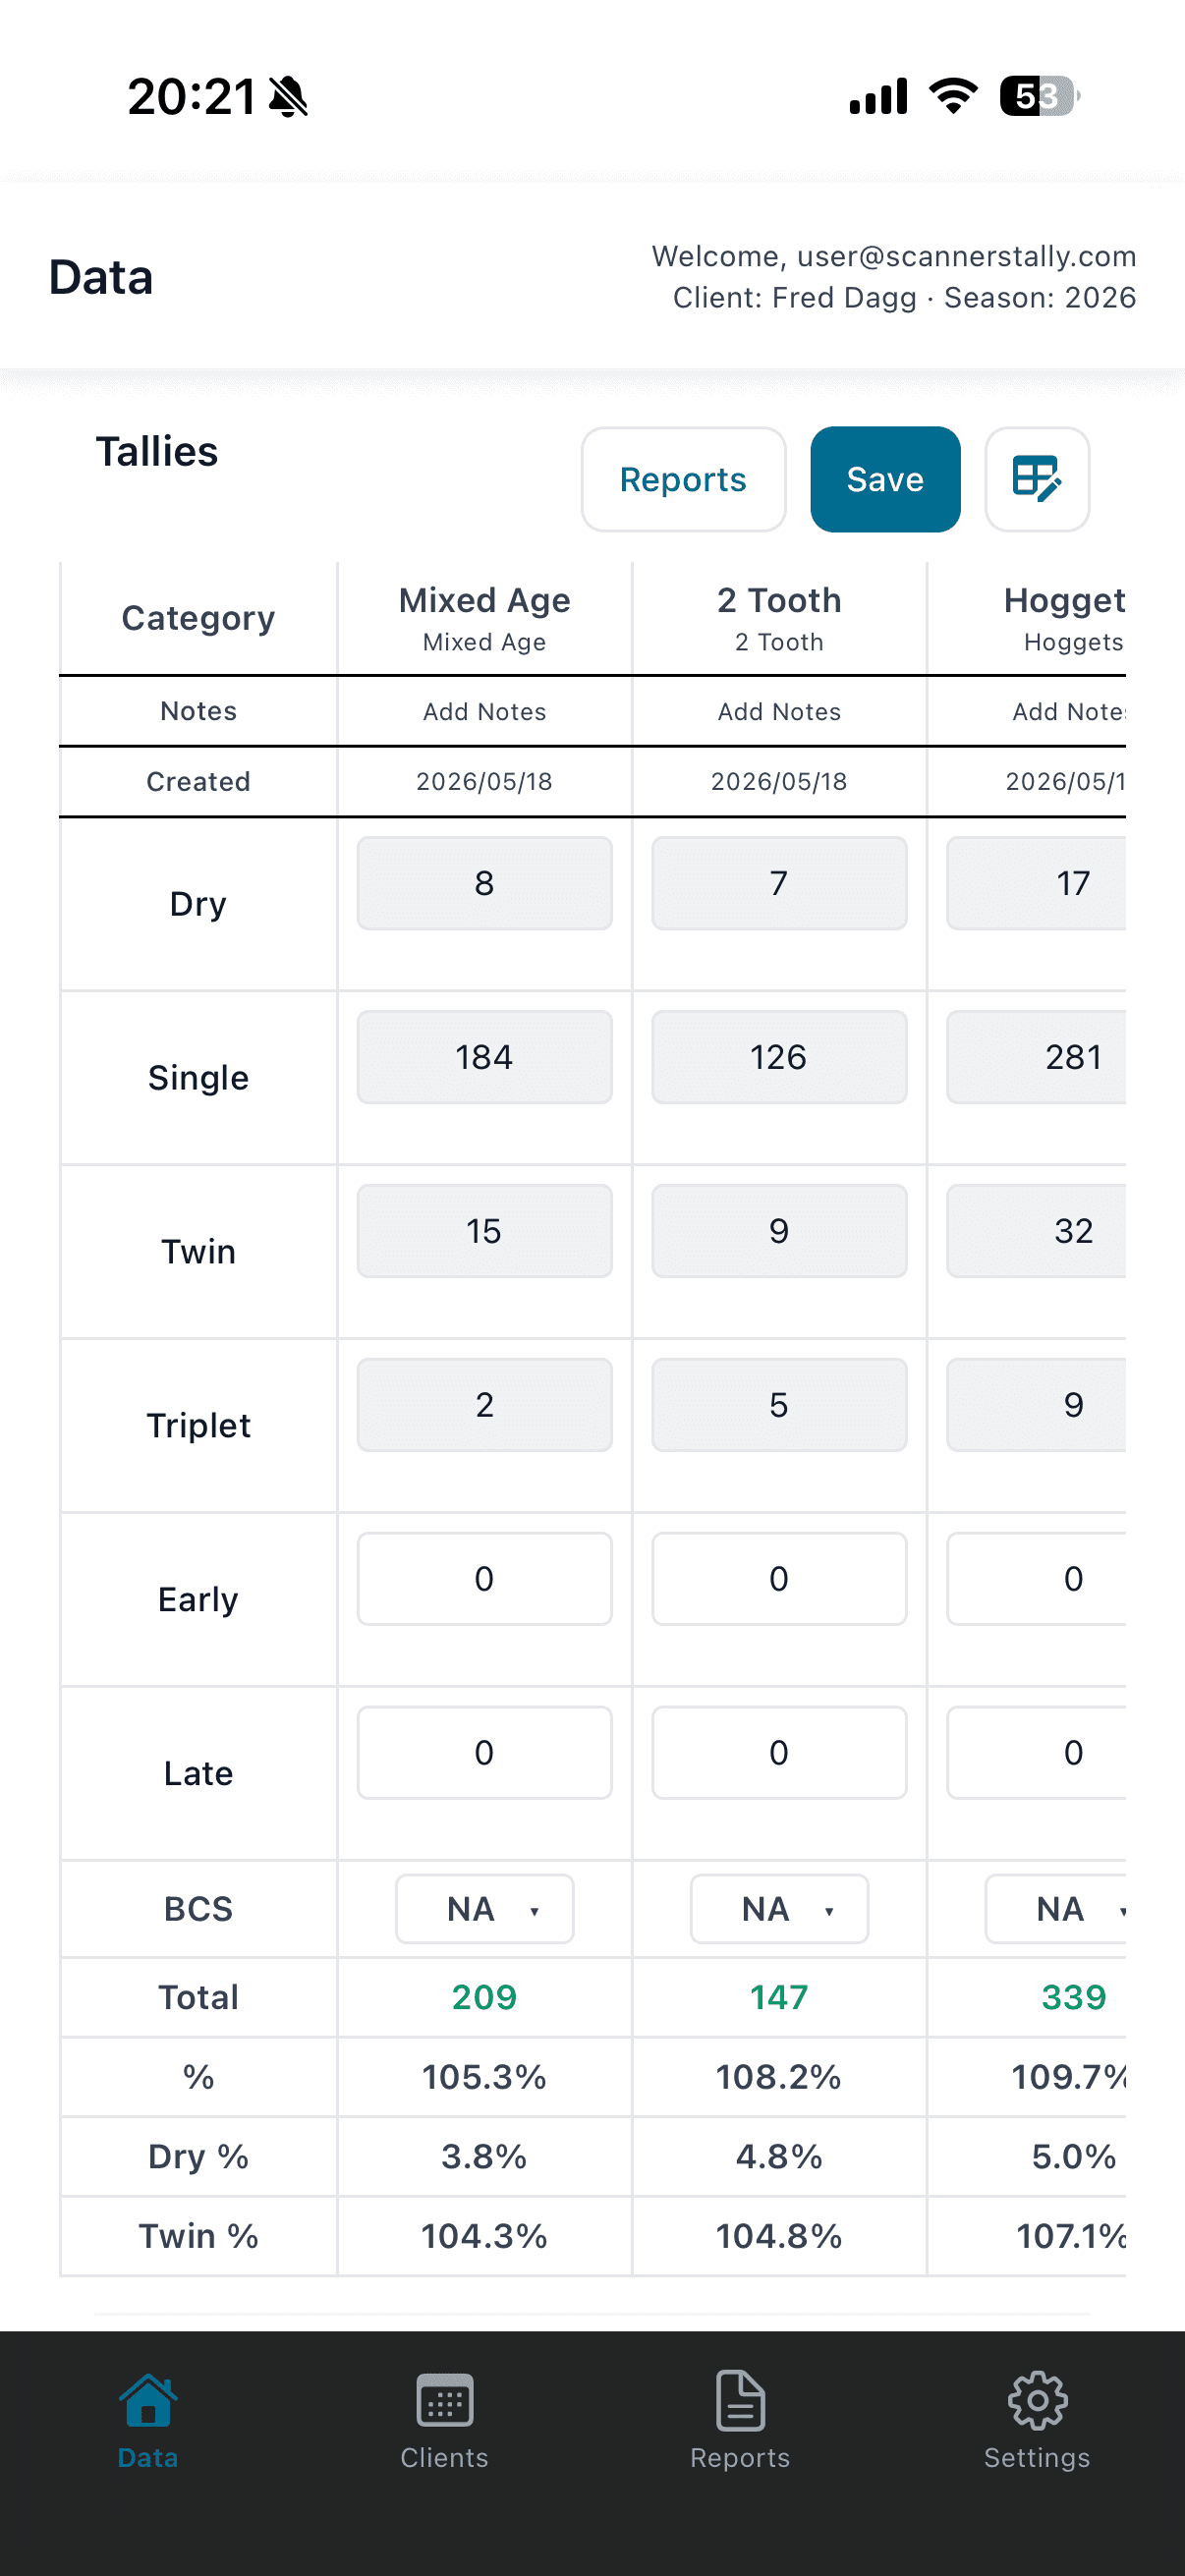
One platform to share and analyse all your scanning data
Data syncs automatically with our platform, view every job you've done in one place.
Your whole season in one console.
Every job you scan rolls up into one place. Tallies, lambing percentages, and client history, all easily retrievable and ready to share.
- Drop your admin to almost 0 — we make end of month billing easy with monthly overviews of what you've done that month, use our Xero integration for even easier invoicing. We already know how hard you've worked, let us do the admin.
- Trends across seasons — compare this year against every year you have scanned.
- Client-ready reports — a summary per farm without touching a spreadsheet. No more lost dockets, missed revenue, or searching for photos of your ultrasound machine in your phone trying to remember which mob is which.
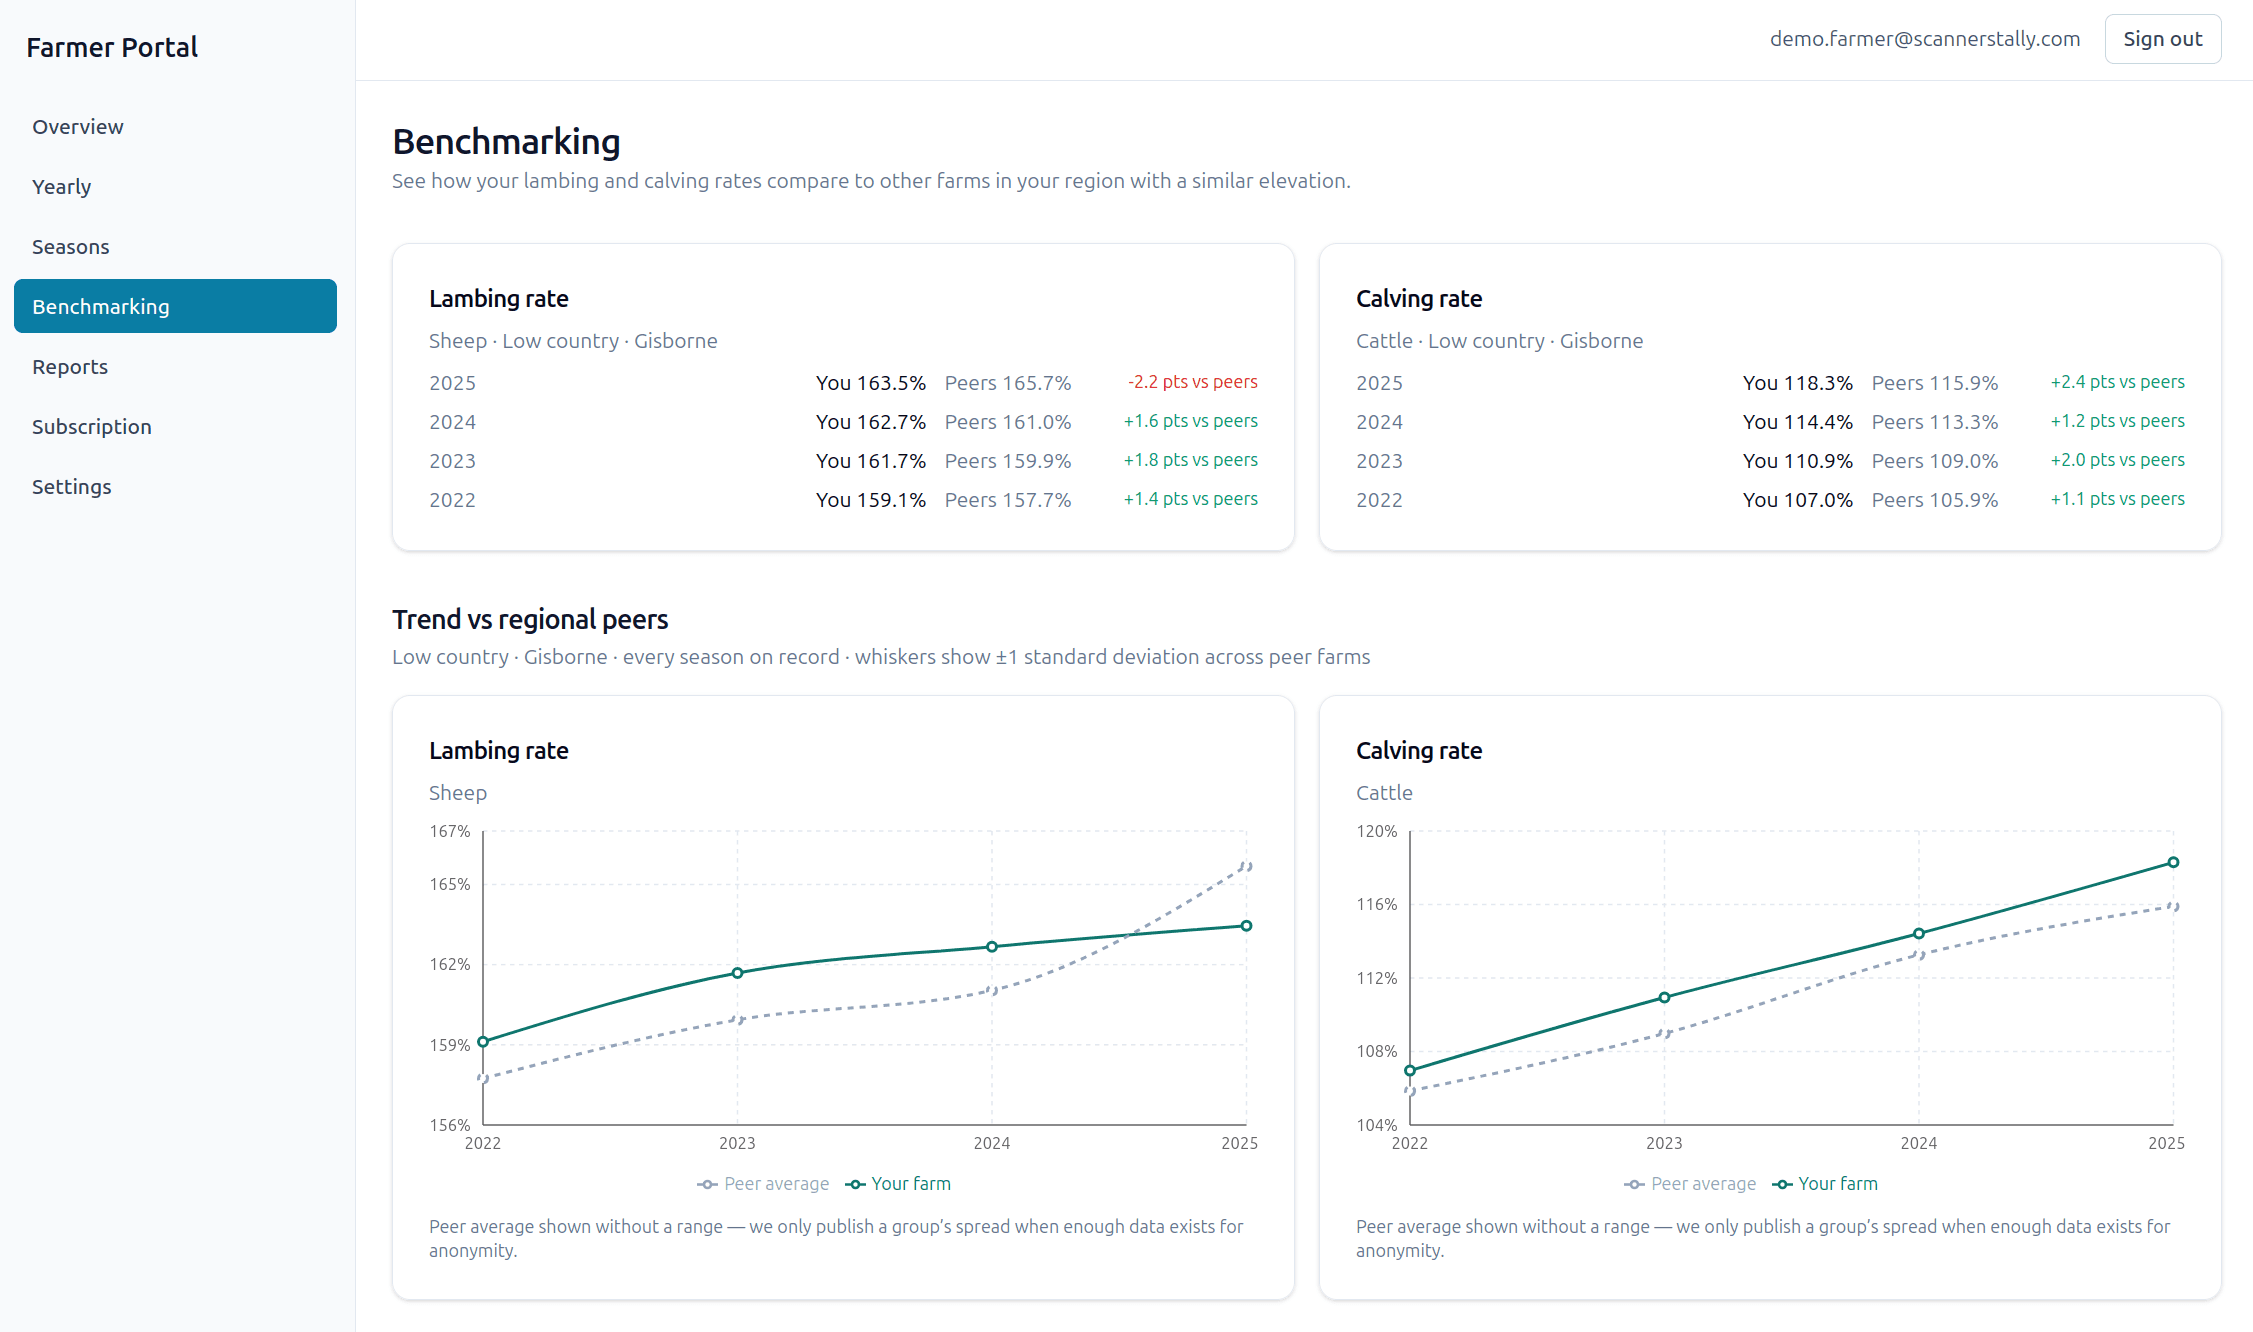
Farmers get instant insights and analytics for their upcoming flock.
Every farm gets a portal of their own. They see their results the moment you sync, with live benchmarking and analytics.
- Regional benchmarking — anonymised data allows farmers to check their lambing and calving rates against comparable farms.
- Season history — every scan on record, no more manual data entry and copying from photos or dockets to a spreadsheet.
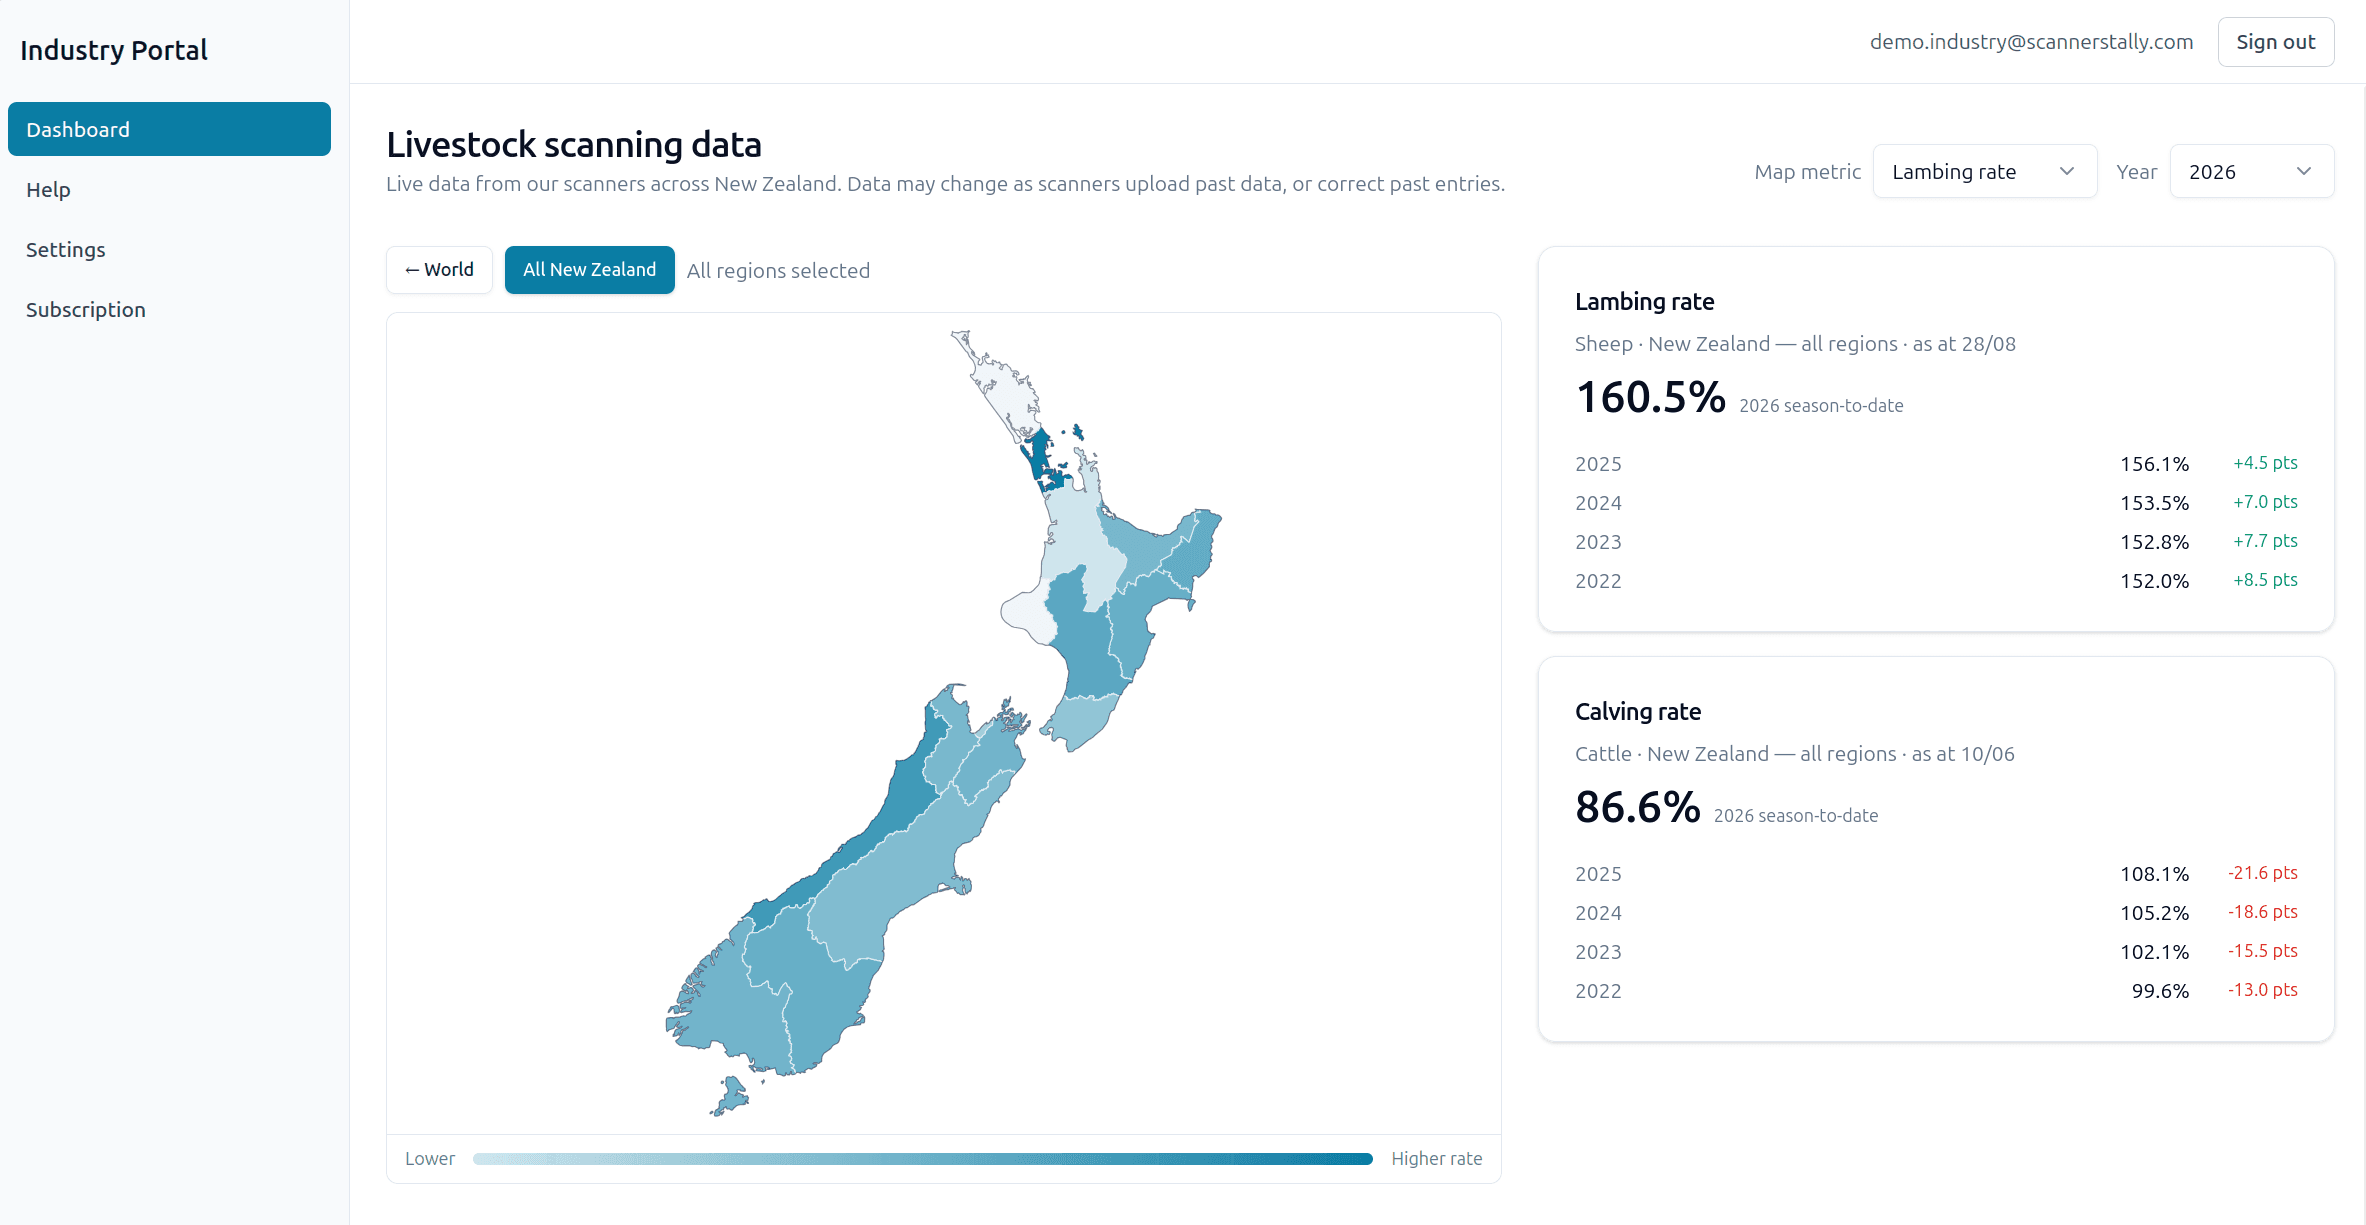
Industry-wide visibility, as it lands.
Industry players can see anonymised national scanning data aggregated across the platform.
- Live regional maps — lambing and calving rates by region, updating as scanners upload.
- Risk management metrics — tools to help industry players manage their operational costs.
- Contact us — Get in touch to see how we can help your business or industry body be more data driven.
Got a question?
We are scanners and engineers who grew up in rural New Zealand. Ask us anything about the app, your data, or getting set up.